
In today’s edition of “Insight’s Inbox,” we answer a reader’s question on how to make a PanelView Plus or View Machine Edition trend contain historical data.
Reader’s Question:
I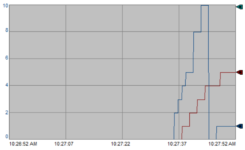 ’m using FactoryTalk View Machine Edition and I would like to make my Trends historical so I can scroll back in time to view previous data on the Trend.
Insight’s Answer:
To do this you’ll need to create a Data Log Model, set it to run automatically, and then tie it to your existing Trend object.
Below I’ll list the steps needed to make this change, however I will assume the reader knows how to open their project in View Studio, as well as which graphic display their trend is on.
Step 1) Discover which tags are displayed on your trend
Open your project in FactoryTalk View Studio, then open the Graphic Display with your Trend, and then double click on the Trend Object to bring up its properties.
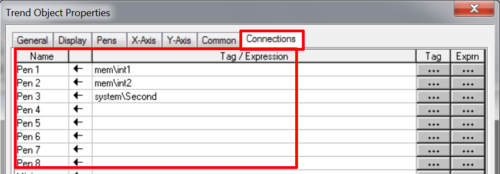
Next, select the “Connections” tab and make note of every tag listed.
In the example below, my Trend Object has three tags: memint1, memint2, and systemsecond.
Step 2) Create a new data log model
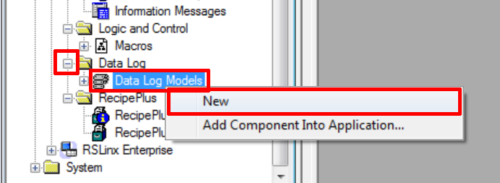
Now return to the project tree, expand the “Data Log” folder, right click on “Data Log Models,” and select “New.”
Step 3) Describe Data Log and Define Maximum Data Points.
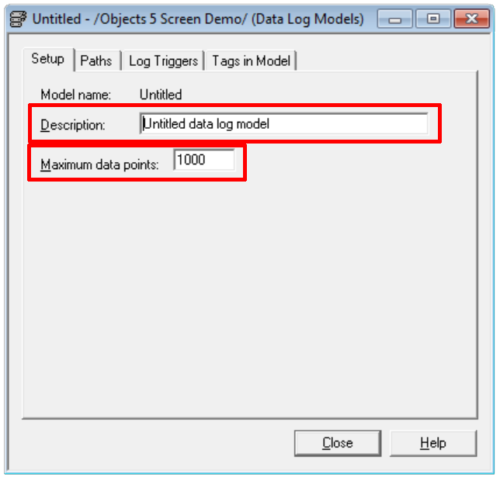
Once the new data log window appears, give your new data log model a description and provide a maximum number of data points you would like the log to hold.
Note: “Maximum Data Points” refers to all the data collected for all tags in the data log model. When the maximum is reached, the oldest data is overwritten.
Step 4) Understanding the “maximum data points” setting in FTViewME 7.0 and higher
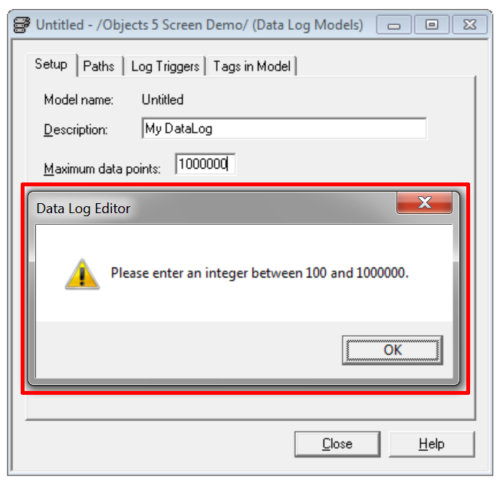
The maximum number of data points in a data log file in View Machine Edition 7.0 or higher is 1 million (all previous versions were limited to 300,000.)
This means if you set the maximum data points to 1 million, and have the maximum number of tags being logged (100,) each tag can have up to 10,000 data points of historical data logged in the data log file.
Step 5) Choose your desired path to store the data log file.
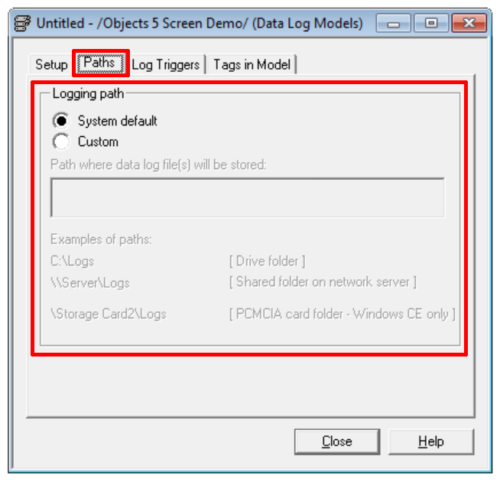
Now select the “Paths” tab, and choose where you would like the data log file stored.
“System Default” stores the data log file with the project and is by far the most popular choice.
“Custom” allows the data log file to be stored in another folder on the local drive, storage card, external storage device, or on a network share.
NOTE: It is important to note that if the data log file becomes unavailable (i.e. an external storage card is unplugged or the network goes down) then data will stopped being logged until the path becomes available again AND the project is restarted.
Step 6) Configuring Log Triggers for Periodic
Next click on the “Log Triggers” tab and select “periodic.”
Now choose how often the data for all tags should be logged (the fastest interval is 10ms.)
NOTE: If you set the maximum data points to 1 million, have 100 tags being logged, and set the log period to 50ms, each tag will only have about 8 minutes worth of historical data logged.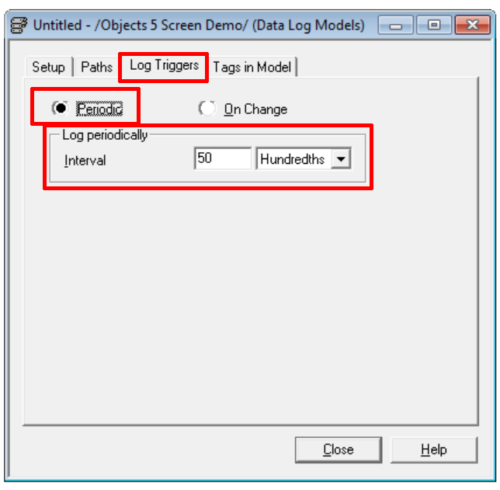
Step 7) Optional: Configuring Log Triggers for On Change
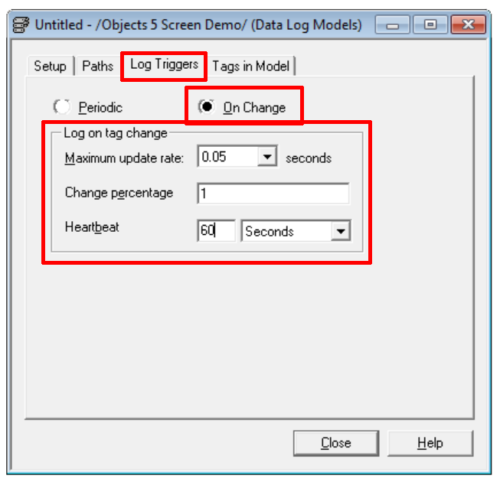
In applications where tag values change little over time, the usefulness of the data log can be greatly extended by using the “On Change” log trigger.
To do this, select “On Change” and then choose the desired “Maximum update rate,” “Change percentage,” and “Heartbeat.”
 Step 8) Add tags to data log model
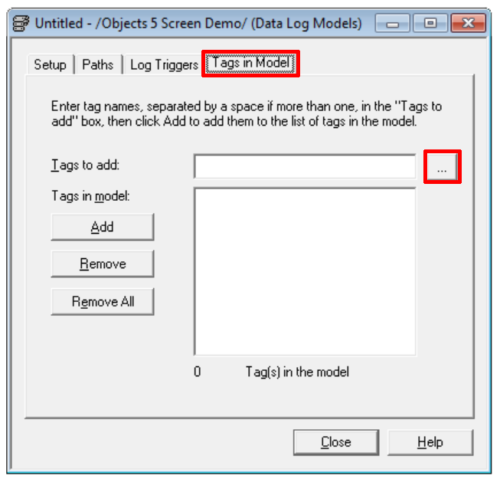
Now select the last tab of your new data log configuration, “Tags in Model,” and then click on the ellipsis button (with the three dots:)
 Step 9) Select tags from Tag Browser
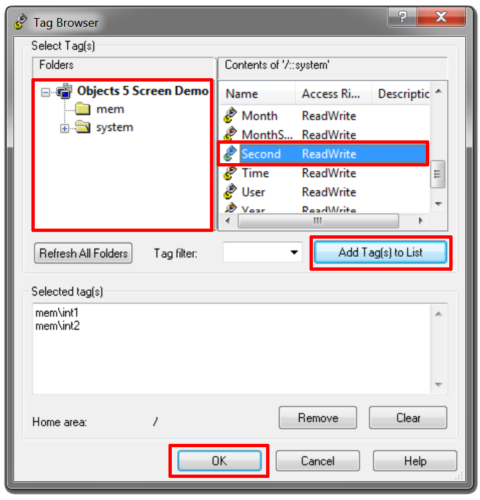
You should now see the “Tag Browser” as shown below.
Navigate the browser to find each tag listed in Step 1, selecting each tag and clicking on the “Add Tag(s) to List” button.
When done, click on “OK.”
Step 10) Adding Tags to Model
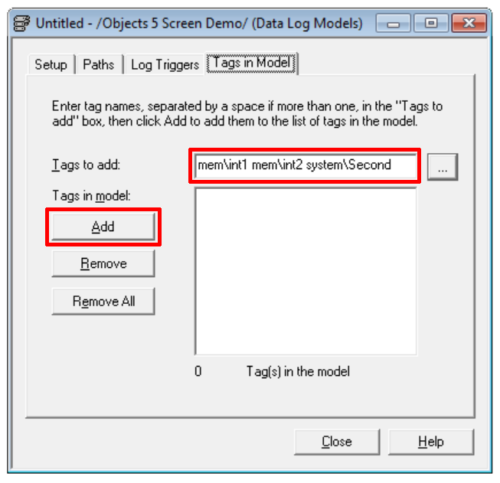
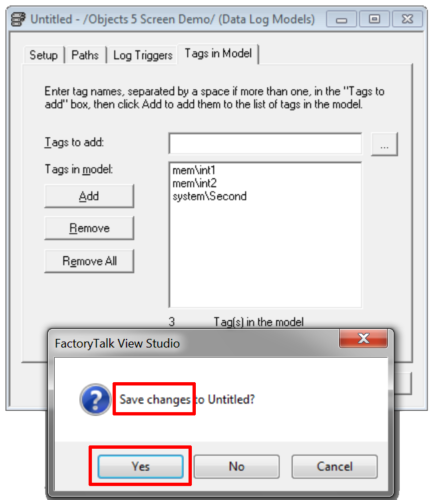
Back on the “Tags in Model” tab, click the “Add” button:
 Step 11) Approve Changes
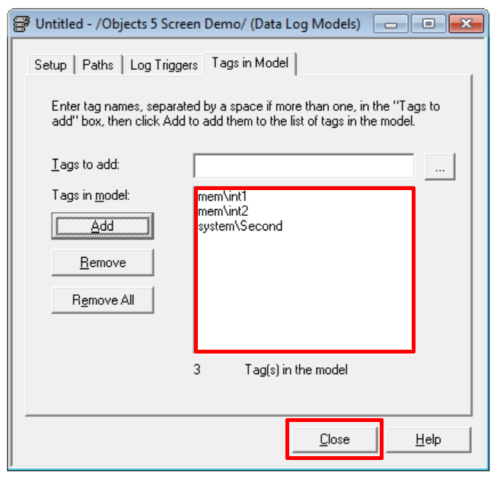
Once all the changes to your new data log model is complete, click the “OK” button.
 Step 12) Save your new Data Log Model
At this point you will be prompted to save your data log model.
Select “Yes” to continue:
Step 13) Name your new Data Log Model
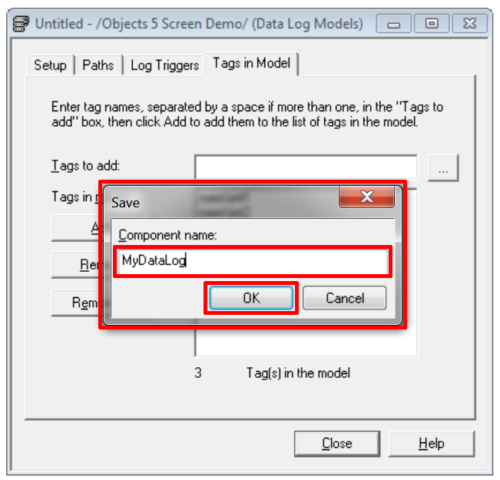
Now provide a name for your data log model, and click on “OK.”
Step 14) Verify your new data log model has been created.
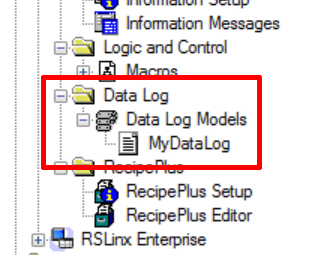
Verify your new Data Log Model has been created by insuring it now appears in the project tree under “Data Log Models:”
Step 15) Edit your Trend and specify the data log model
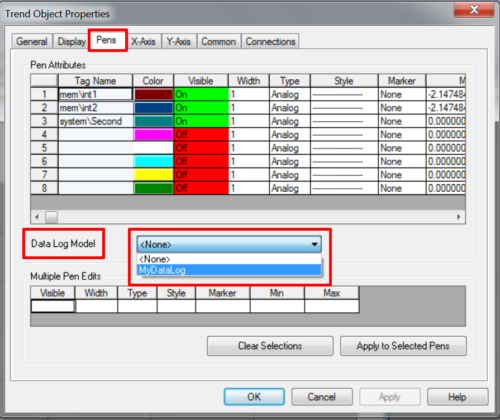
Now return to your Graphic Display that contains your Trend Object, and open the Trend’s properties.
On the “Pens” tab, select your new “Data Log Model” as shown below.
Now click “OK” and save your graphic display.
Step 16) Set the Data Log Model to start logging on startup
In most cases you’ll want your data log model to start logging data when the project starts.
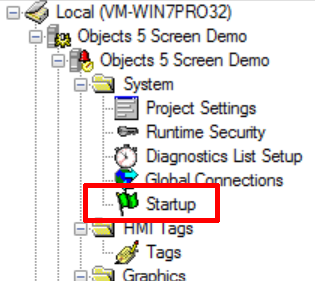
To enable this, in the project tree double click on “Startup:”
Step 17) Choose which Data Log Model runs on startup
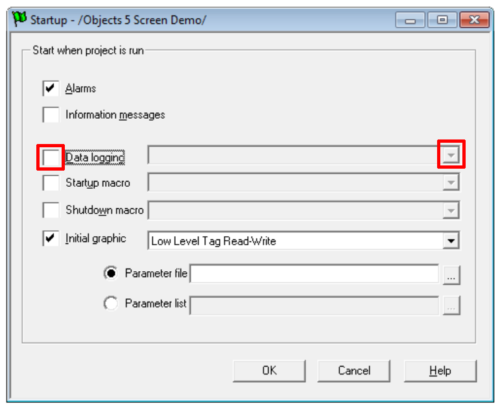
In the Startup configuration window, select the checkbox to the left of “Data Logging,” and then select your data log model from the drop down list.
 Step 18) Accept Startup changes
Once your data log is selected to run on startup, click the “OK” button to accept your changes.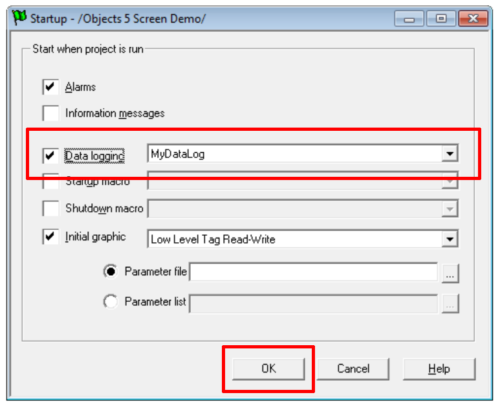
Step 19) Run PanelView Plus / View Machine Edition project to insure the trend is now historical
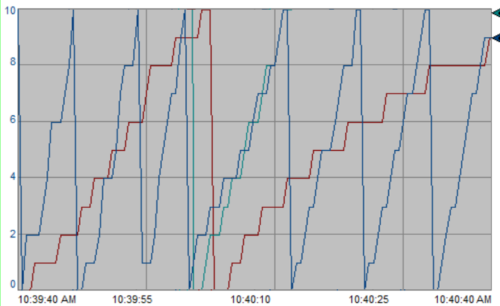
Run your project, and after a couple of minutes view your trend screen to insure your trend now contains historical data like the trend below:
NOTE: You can get an “ad free” PDF copy of the article HERE, and a copy of the sample program HERE.
I hope you’ve found today’s “Insight’s Inbox” about making a PanelView Plus or View Machine Edition Trend Object display historical data helpful.
If you have any comments, questions, or suggestions, please feel free to share them with us by submitting the “post a comment or question” link below.
Update: If you have your own question you’d like to ask, please post it as a comment on a related post here at TheAutomationBlog.com
Until next time, Peace ✌️
If you enjoyed this content, please give it a Like, and consider Sharing a link to it as that is the best way for us to grow our audience, which in turn allows us to produce more content 🙂
Shawn M Tierney
Technology Enthusiast & Content Creator
Support our work and gain access to hundreds members only articles and videos by becoming a member at The Automation Blog or on YouTube. You’ll also find all of my affordable PLC, HMI, and SCADA courses at TheAutomationSchool.com.
- Digital Twin Discussion with Arthur Alter of Smart Spatial (01/15/26) - January 15, 2026
- PRONETIQS: Measure, Monitor, and Maintain (P257) - January 14, 2026
- FactoryTalk Design Workbench First Look, CCW Comparison - December 19, 2025

Discover more from The Automation Blog
Subscribe to get the latest posts sent to your email.




Hello Shawn
First of all, congratulations! very good blog! Thanks!!
Question:
Is there a way to show at the bottom of the trend:
Color, TAG and Units (like in FTV SE) ?
Regards from Bolivia!
Thanks for your kind words.
To your question, the best example of what the trend can do is found in the Graphic library – I actually don’t see a way to turn on the bottom section you would see in FTViewSE – however a lot of the Trend object is exposed to the system, and the Library shows some examples od displaying Pen values and Play / Pause / etc buttons.
PS I don’t have v14 installed, so check my recent interview with Rockwell (or the release notes) for more info.
Shawn
Shawn,
I am having trouble with keeping the data in a historical trend. I connect the pens to a data log and have that data log “running at startup”. I am not sure if I am missing something? I have tested the trend for an hour and it works fine, but when I switch to 30 days it will not keep the data or something happens for it to either stop or start over. Do you have any ideas as to why this is happening?
Leyton Allen
Leyton,
What do you have for settings in the following steps:
– Step 4 – maximum data points
– Step 6 – Log trigger settings
– Step 11 – Number of tags in your log
Shawn
[sc name="stsigcom"]
The max. data points is set to 60000 – step 4
The Log trigger settings is periodic with an interval of 10 seconds – step 6
The number of tags in data log is 16 – step 11
Let’s run those numbers (please verify yourself – I’m doing this over coffee and for free so won’t be double checking ;-):
So 60,000 total data points /
1116 Tags =54543750 data points per tag.And with a 10 sec log rate, that would equal 6 data points per minute, for a total history 625 minutes (3750 / 6 per minute) or ~10.5 hours of data per
pointTag.That’s less than one half day of historical data, and that might not show much with a 30 day time span?
Not sure why you wouldn’t try maxing it out at 1 million records (version dependent) unless you’re out of space, which I highly doubt unless you have a really old 32mb PVP.
Shawn
[sc name="stsigcom"]
I will try this, thank you. I am confused as to where your 5454 value came from? Could you explain this please?
I have a few of these trends going on different HMIs and they are all different versions of factory talk. I noticed on one that runs a 5.10 version, it says that the max number is 300,000 (step 4). Is this just a set value for this version or could I possibly change this to increase its value?
You must be reading an old email notice (?) I deleted the 5454 number within seconds after posting my reply… I just added it back in so you can see how it was calculated, and honestly everything you need to know I already posted here in my reply.
Good luck!
Shawn
PS – If you have further questions or need additional help, buy me a cup of coffee over at locals and I’ll help you there:
[sc name="stsigcom"]
Is it possible to have multiple “data loggings at startup” or are you only allowed to choose one?
— merged —
Is it possible to select more than one data log when you go into the “statrtup” menu?
I have more than one data models that I would like to have a “historical” view of.
If you look at step 17 in this article, you’ll see you can only choose one, and I can confirm at the time I created this article there was no way to run more than one at a time. This is one reason the DataStorePlus add-on was popular.
I personally haven’t seen anything in the release notes since then that this has changed, but I’d recommend you take a look yourself.
Shawn
– – – additional reply – – –
Not sure how you could miss my reply, but it’s a fact that since FTViewME v1.0 it has never allowed you to select (or run) more than one Data Log file at a time.
If you want to be sure this feature hasn’t been added in a recent release, go read the release notes – I’ve read them for every single release, and I’ve never seen that changed, but you should read them for yourself if you need that feature.
PS – Please don’t post this question a third time
[sc name="stsigcom"]
Sorry about that… for some reason it was not showing up on my end…
Another question:
My coworker mentioned something about using a macro to be able to run multiple historical trend screens.
Is this possible and if so do you have any instruction on how to do this?
Well, I’m not sure there is a question there.
Yes, ViewME does have a very simple Macro function, and does support displaying multiple Screens at the same time as popups (which is now supported under Startup too,) and you can even place multiple Trends on a single screen.
But you (still) can’t run multiple datalogs (unless I missed a new feature mentioned in the release notes) which is why many use the free Data Store Plus add-on.
Shawn
Hello,
Is it possible to configure it so that it uses the datalog to display the values in the trend ie. the data is still visible in the trend after a reboot??
Good morning @Emil,
Absolutely – see step 15 above 🙂
Hope this helps,
Shawn Tierney,
Instructor at http://www.TheAutomationSchool.com
Hi Sean. When I reboot, the panelview does start logging again, but from the beginning (the trend chart starts from the time of the reboot) – is it not possible to have it reboot and continue from the last log entry so the previous historical data is retained and shown in the trend again after a reboot? I think this is what Emil was getting at.
Good morning,
Yes, if the Trend is set to historical and the data log is logging data then it will pickup where it left off.
What version of FTViewStudio are you using, and what PanelView Plus do you have, and what’s its firmware level?
Shawn
Hi Sean, the trend is set to historical in that it uses the standard datalog component. I have FTView ME 12.0, the HMI is a Panelview plus 7, v11 firmware. If rebooted (power cycled) it starts logging again, but from the beginning and has no historical data except for what it logs after the reboot. The trend starts from scratch but does log (after a minute or two we can scroll back and loading the trend screen shows it is logging historically. There is from memory, a setting on the panel to delete logs on startup, could this be the issue?
Good morning,
Yes – if the terminal is set to delete all logs on startup that could be the issue, as well as the log settings if they are set to only have a single log file – please let me know if either of those are causing the issue you are seeing?
Shawn
Yep, in the startup settings of ME on the panel, it was defaulted to “delete all logs on every power cycle” which was the cause. I’ve now switched that to “no” and it can be power cycled while retaining the existing log data and continues from where it left off before the reboot. Perfect.
It still occasionally complains about the path of the file on a restart but rebooting it again sorts it out, and logging commences once more. No idea why it likes the path most of the time and sometimes not, but since it won’t be restarted most of the time in it’s life, this should be fine. I’m logging to an 8gb USB and it works perfectly unless I’ve powered the whole system on including the PLC, then simply power cycling only the HMI fixes that issue.
Thanks for an excellent resource and for the prompt responses to an older thread. Superb.
Oh and sorry for mis-spelling your name! I was on autopilot.
Good morning Sol,
Looks like I can’t reply to your last post so I’ll reply to mine just to say “thanks” for getting back to me, and I think it’s likely that the USB you are using is likely just being recognized and mounted slowly by the built-in OS. You may want to try switching to a different USB stick or a Memory Card.
And no worries about the name, it’s one reason why neither of my sons are named any version of Shawn lol.
Hi Shawn,
I’m having an issue when I click my “pen swap” button. I Have a trend that monitors a Tank Level (0-100%) and Tank pH (0-14). When I click my “pen swap” button, the scaling to the left of my trend changes accordingly, however, is there anyway that the data already logged can change to match the scaling. What I mean is when both devices are being monitored at the same time and lets say i’m currently on the (0-100%) scale, the pH will also be on the same 0-100% scale but on the very bottom part of the graph. And now once I click “pen swap” to change the scale from 0-100 to 0-14, the data stays at the same bottom part of the screen and not adjusted to the appropriate scale. Its like I would have to have a separate trend for each value which is a little cumbersome for smaller screens.
Thank you!
Damian
Good afternoon Damian,
What version of ViewStudio Machine Edition are you using, and are you using the Trend object discussed in this article?
I’m in v10 right now and I don’t have a pen swap button nor 0-100% Y axis options.
Check out the Trend library to see what I mean,
Sincerely,
Shawn Tierney,
Instructor at http://www.TheAutomationSchool.com
[sc name="stsigcom"]
Shawn,
In your first picture there is a tab for Y-axis. Then inside the tab you can choose to scale according to your pens (if you have a different scale for each pen) or a custom scale ( 0-100, 0-14, etc., whatever you want). The pen swap button is something I created that swaps pens on the trend screen so you can see different trends with different scales on the same 1 trend. I have v11.
Damian
Good morning Damian,
So in ViewStudio ME v10, if I scale each pen to a custom scale of 0-100%, then really they are all on the same scale, which may be why you’re seeing the result you are 🙁
If you scaled Pen 1 to 0-500, and Pen 2 to 0-1000, while the plot you see would not change by switching pens, the Y Axis labels would change to match the selected pen’s scale.
One option would be to have three different templates you could load: one for Pen 1, one for Pen 2, and one for Pen 1 & 2. Maybe even add a template for “Isolated Graphing?”
Best of luck!
Shawn Tierney,
Instructor at http://www.TheAutomationSchool.com
[sc name="stsigcom"]
Hi Shawn,
If I am selecting the system default as my path for historical trending, where can I find this log file to analyze my data?
Thanks,
Scott
Hey Scott,
Your best option is to set the path to a known “custom” location.
Then use the tool found at, “Start–>Rockwell Software–>FactoryTalk View–>Tools–>FactoryTalk File Viewer” to open and view the datalog.
I’m not in front of a PVP at the moment, but if you exit ViewME Station, and browse internal memory for the project folder, you should find a DLG folder inside of it.
Also keep in mind that while you can see the Datalog folder in your project on your PC (like C:\Users\Public\Documents\RSView Enterprise\ME\HMI projects\TEST\DLG) this is not used when you “test run” your project from Studio.
Test running an application on your PC will use a temporary location like:
C:\Users\IIA\AppData\Local\Temp\~MER.00\
Also, the exact path may be different depending on your Windows OS or PanelView Plus vs 6/7 – so the best way to find it is to browse for it using File Explorer.
But again, I’d recommend data logging to a known custom path to simplify things.
Hope this helps,
Shawn Tierney,
Instructor at http://www.TheAutomationSchool.com
[sc name="stsigcom"]
Thanks a lot for your post!! I’ll try to do this
Good luck!
Shawn
[sc name="stsigcom"]
Hello, thanks for your perfect explanation,
my trends have been working for months and suddenly it stopped logging apparently (I am using default path), what happens when the log reaches the ‘maximum data points’? it is there an easy or auotmatic way to restore it?
Thanks again
CR
Good morning CR,
You’ll want to check the diagnostic log to see if an error caused the datalog to stop, as well as the terminal’s memory to insure it’s not full.
That said, the built-in datalog is a round-robin style which always replaces the oldest data with the newest, and you can set the max number of data points it holds in the datalog setup as shown above in step 4.
Hope this helps,
Shawn Tierney,
Instructor at http://www.TheAutomationSchool.com
[sc name="stsigcom"]
Thank you Shawn. I try to test it according to your suggestions. Regards, Francisco.-
Thanks and good luck with your project Francisco,
Shawn Tierney,
Instructor at http://www.TheAutomationSchool.com
Dear Shawn, good morning.
Instead of use a trend, is there a possibility to shown a data table in Panel View? I mean, to show all data (time and tags values like a history) using rows and columns pasted in a display?
Thank you very much, the blog is amazing!
Francisco.-
Good morning Francisco,
Thanks for your comments. I don’t believe there is a way to change the Trend into a “Table View,” but Rockwell did add some new features in the last release which I haven’t tried yet?
Sincerely,
Shawn Tierney
[sc name="stsigcom"]
Thank you very much Shawn! Regards, Francisco.-
Thank you very much Francisco,
Have a great week,
Shawn Tierney
[sc name="stsigcom"]
Dear Shawn,
I’m working with trends, I have two questions:
1- Can I view values on the pens? How can I configure markers?
2- The datalogger works perfect perfoming a simulation (with Factory Talk), but, it´s not the same behavior downloading .mer on the Panel View. The pens dissapear when for example I change display and come back to the display with the trend object. After that, I have to wait same seconds to see them again, but, starting again (I loss the data).
Thanks in advance, Francisco.
Good morning Francisco,
If you’d like to try my project, you can grab a copy of it for a $0.99 donation here:
https://theautomationblog.com/shop/panelview-plus-historical-trend-demo/
Now some questions and things you might want to try with respect to question 1:
– When you touch the Trend do you see the value bar?
– Do you have all your pens on the same chart, using the same scale? (see Y Axis settings)
– If you have each pen on it’s own scale, what happens when you add then click on a Next Pen button? Does the scale change to match?
– Do you see the marker setting in the pens tab?
As far as question 2, as I show in this article you need to have logging setup and running to get historical trends. If it’s setup correctly you can press the rewind button and see old data.
Note – a good way to see the difference between historical and live data is to turn on markers, and then set the datalog to log data every 5 seconds, but the trend to update every 1 second.
In this scenario the live screen will have a marker every 1 second, but when you leave the screen and come back all of the historical data will have a marker every 5 seconds.
Good luck,
Shawn Tierney,
Instructor at http://www.TheAutomationSchool.com
[sc name="stsigcom"]
Hello Shawn,
Thank you for all this information. I find your blog to be quite informative and that is why I keep coming back.
I have a question: If I were to update my FactoryTalk View ME application and create a new Runtime file, do I lose all my previous DataLogging info for trending? Is there any way to retrieve that data and show it on the trend. I’m trying to keep all historical data and not have to start trending all over again any time I make a change to the application and reload the Runtime application. I’m thinking that there would be a way to pull that data from the already saved Datalog Files?
Your advice will be greatly appreciated!
Thank you,
Robert
Good afternoon Robert,
Great question.
I’ve never actually tried this, but one would hope if you uploaded the .MER and converted it back to an APA it would also upload and keep all the logs, including data, activity/diagnostics, and alarms.
However, I’m also not sure if you just change and download the offline copy of the app if it will keep the old logs?
Since I also don’t recall seeing this documented anywhere, the only way to know for sure may be to test it out?
Sincerely,
Shawn Tierney
Hello,
I wonder if it’s possible and how to select the pen as I want to see if the graph has one more tag.
Good afternoon Giulia,
If you look at the Trends Library you’ll see there is a “Next Pen” and “Previous Pen” button which allows you to select pens individually.
Hope this helps,
Shawn Tierney
Hello,
Recently I went through the setup of a trend screen doing all the above steps. What is happening is randomly I will lose my trended data (ranges from an hour to eight hours) then it will come back online and work again. I originally thought that it was a networking error, but starting to think it is something else due to the amount of time it takes to come back online and start trending. Currently, I am not using a Flash Memory card of any sort, and am running a Panel View + 7 with ver. 7.00.
One step that I had not done until now is the “startup” > “data logging” > then selecting the data model. Would this cause a problem like this? The trend screen is working now, but not sure if it will drop out again or not.
Any thoughts of what could be going on would be greatly appreciated.
Thanks,
Jeremy
Good morning Jeremy,
Yes, without a “datalog” the trend will only show you what it has buffered in “ram,” and if the trend screen is closed (and not running in the background) when it is re-opened it will start buffering data in ram from scratch.
To get the best of both worlds, set your trend to buffer the maximum number data points in ram and never all that trend screen to be closed / replaced. Also, tie it to a datalog set to log the maximum number of data points.
When I do this, I let the Trend collect data faster than the Datalog, so my realtime and near recent data has many data points, but when I go back in time past what is in ram I’ll see the data from my data log, which I logged slower so it goes back much farther than what will fit in ram.
Hope this helps,
Shawn Tierney
[sc name="stsigcom"]