 I run into this more often than you would think.
I’ll be working with a controls engineer, or in a manufacturing facility in front of a PanelView Plus or FactoryTalk View SE SCADA system, when I notice the system seems to be running slow.
This sluggishness often has nothing to do with the type of network being used. I’ve seen it happen on RIO as often as I’ve seen it on Ethernet.
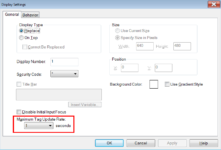
The reason for it is almost always caused by a default setting of every new project and display you create within View Studio: The “Maximum Tag Update Rate.”
 This value, found in the display settings of each and every screen in a FactoryTalk View project, accepts a range of .05 seconds to 120 seconds.
However, it defaults to a sluggish 1 second update rate.
Now you may think that 1 second isn’t too bad. But when set at 1 second, I typically see a round trip response from “button push” to “on-screen indication” of nearly three seconds.
Why? Well, if you press the button just after the update occurs, you’ll have nearly a whole second go by until it’s read. And once it’s read and sent to the PLC, you’ll then have close to another second until the screen updates again to indicate its on.
Now in my time working with in-plant operators, I’ve come to the conclusion that they feel most comfortable with a response time of one second or less.
If the screen doesn’t respond in a second or two, they’ll often assume it didn’t read their input and press the screen again.
To avoid this, and insure at least a 1 second update rate, I’ve found you’ll need to set each graphic display screen’s “Maximum Tag Update Rate” to at lease .25 seconds.
However (if your system has the bandwidth) I would recommend a .1 second update rate as it provides for a very snappy system more in-line with today’s expectations.
Unsure if your EtherNet system can handle these update rates? Check out our previous article on using Rockwell’s Ethernet/IP Capacity tool which can help you quickly benchmark a system.
I hope you’ve found the above information about speeding up your FactoryTalk View Displays helpful.
If you have a comment, question, or suggestion please feel free to share it with us by filling out the “post a comment or question” link below.
Until next time, Peace ✌️
If you enjoyed this content, please give it a Like, and consider Sharing a link to it as that is the best way for us to grow our audience, which in turn allows us to produce more content 🙂
Shawn M Tierney
Technology Enthusiast & Content Creator
Support our work and gain access to hundreds members only articles and videos by becoming a member at The Automation Blog or on YouTube. You’ll also find all of my affordable PLC, HMI, and SCADA courses at TheAutomationSchool.com.
- FactoryTalk Design Workbench First Look, CCW Comparison - December 19, 2025
- Drew Allen of Grace Technologies on Automation, Safety, and More (P256) - December 17, 2025
- Robotics in Warehouse Automation with Erik Nieves of Plus One Robotics (P255) - December 10, 2025

Discover more from The Automation Blog
Subscribe to get the latest posts sent to your email.


Hi Shawn,
Thank you for this article (and your youtube videos) all very helpful.
I was hoping you could help with an issue I have described below. I can’t seem to get my datalogger to update in accordance with the refresh rate.
First Question:
I am working in Factory Talk SE Studio, in a network distributed system. I am attempting to determine why my local data Loggers are only logging every 7-10 minutes rather than the 0.3 seconds I set in the refresh rate. I get the same result if I have 5K+ tags in a logger and if I have 2 tags in the logger. I must be missing something as to why that would be such a large gap between the refresh rate and the time it takes to log the value.
I have the following settings in my logger that I feel are pertinent:
Saving to Local file (I can see it in same area as my HMI files)
Log Triggers every 1 tenths (100 ms)
Storage format: File Set
Second Question:
I am doing all the above so that when I pull up trends in Factory Talk it shows the previous data in the log and updating on new entries to the log. I am able to get my trends to update every quarter to half a second once I load the Trend, but the data prior to the time I open the trend only has a data point every 9 minutes (like the issue above), but if I leave the trend running I can see data points coming in every half second or so. So I am curious why it won’t update that quickly when the trend is down.
Things I have tried:
Starting the datalogger in Startup Macro (this freezes the client and no display comes up)
Switching between Historical Data and Real-Time Data. Real Time allows for the trend to update quickly while up. Historical takes that away and just has data every 9 minutes or so.
All in all, I think fixing problem 1 could help fix problem 2. I just can’t seem to find the solution.
Please let me know if you need any follow-up information. Any help is appreciated! Thanks
Hey Don,
I’ve never seen the Datalogger not log correctly, and last time I checked Rockwell still supports 20 Logs running simultaneously, each logging thousands of tags per log.
So I would suggest (1) viewing the log files and checking to insure they are recording data in the time specified. If it’s not, create a new log and change nothing but the tags and log rate, and see if it still works.
Second, set your Trend to use the log file, and set the trend refresh rate to be the same as the log, and add markers for each data point, similar to what I show here:
– https://theautomationblog.com/panelview-plus-make-trends-historical/
– https://theautomationblog.com/insights-inbox-how-do-i-make-a-panelview-plus-trend-historical/
if you have more questions feel free to post them in our community at Automation.Locals.com.
Shawn
Hi,
i have a problem when i open any application with Factory Talk View, i have wait 15 minutes to can accedes and to can change something in the application, do you know someway to accelerate the openning of Factory Talk View?.
I work in a Virtual Machine with VM ware and i use Factory Talk View 6.10.
Best Regards From Mexico.
I’ve found that HMI tags are also slow. Twice as slow in fact.
If the update rate is set to 1 second, then I see 2 second updates with HMI tags.
Changing over to direct reference tags “fixes” that back to the set 1 second rate.
Just another thing to check, especially those converting over from PanelView Standard
Thanks for the heads up Arlen!
I’m hoping to do a future blog on the Rockwell utility which helps with these conversions from HMI Tags to Direct References – it appears to really helps ease the conversion.
Thanks again,
Shawn Tierney
[sc name="stsigcom"]
I’ve noticed the same thing. I’ve been nervous to decrease past .25 seconds since I always see it so high. It’s nice to have a little reassurance.
Good morning Tisha,
Thanks for your comment, I haven’t run into any issues setting the update at .1 as I’ve found most networks and PLC’s can easily handle this.
However, on a really slow network (like an overtaxed DH+) or with a bogged down PLC (memory near full or with multiple HMIs) too fast an update rate could lead to timeout or connection errors in FTView.
Have a great day,
Shawn Tierney
[sc name="stsigcom"]