While many times underutilized in an HMI, everyone involved in a manufacturing process benefits from trended data, or at least, they would benefit if they used it.
Operators can monitor the direction of their process and better understand how things are controlling and operating, maintenance personnel can use trends to detect and troubleshoot problems and engineers can use them to tune controls and stabilize operations, just to name a few.
In today’s article, I’ll take a look at setting up a Trend Chart in Studio 5000 View Designer.
Adding a Trend to a View Designer Screen
In my simulation project that I have covered for several weeks, I have now added another user-defined graphic page called “TrendData” in which I will add a Trend Chart to view at runtime.
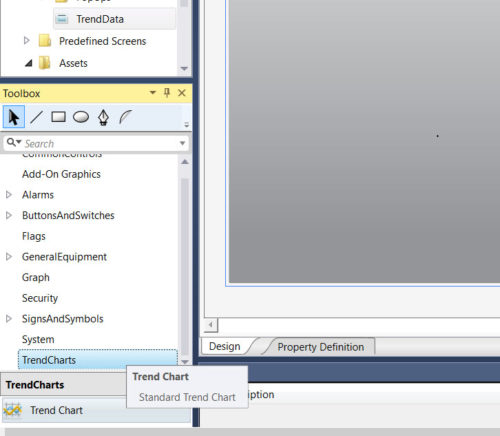
In the following screenshot, you can see the toolbox has a section called “TrendCharts” and a “Trend Chart” object that I will add to my blank screen.
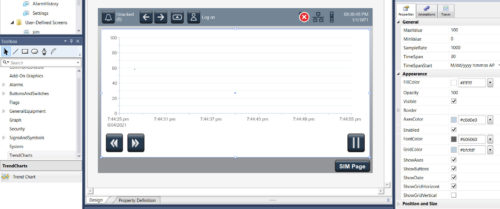
Here I add the “Trend Chart” to my HMI Screen called “TrendData”
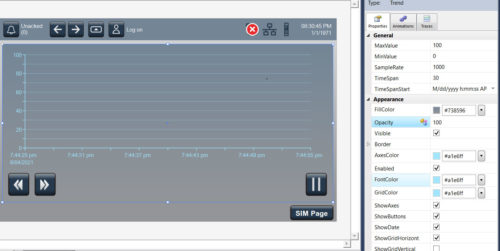
Under the Properties tab on the right side of View Designer, I set my trend background colors, widths of lines and other basic properties to get my trend chart looking the way that I wish for it to display at runtime.

Adding Traces
Traces are what would also be called “pens” in trending terminology. They are the values that are to be trended at runtime.
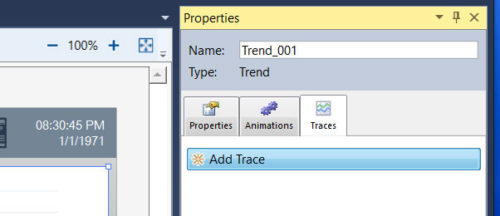
On the “Traces” tab, click on the “Add Trace” button to begin adding values to the Trend Chart.
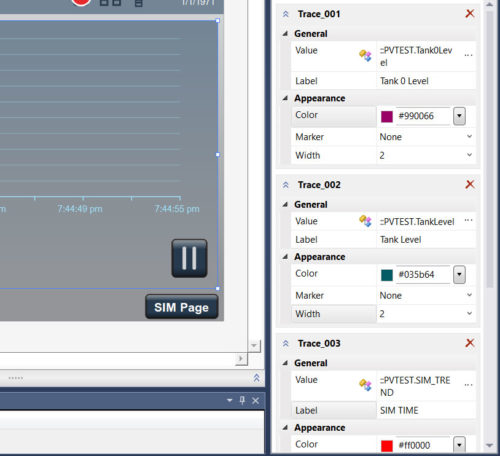
Here, I have added four traces and assigned tags from my Compact Logix Controller tags.
Project Emulator
Normally I would download my Trend Chart additions to my PanelView 5510, but here I want to make use of a feature in View Designer – the Project Emulator.
The emulator will allow you to test your View Designer project without having to download to physical Panelview hardware. This is only a testing solution, because the maximum runtime for the emulator is two hours.
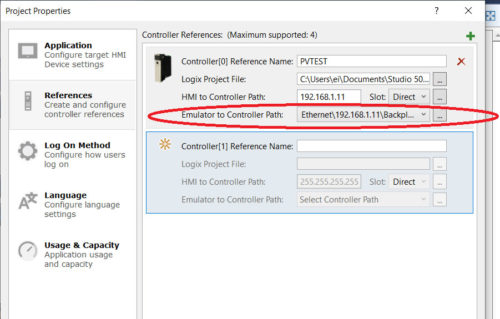
The only setup to running the emulator is found in the project properties, under the references tab. Here I set the path for my emulator to reach my controller as shown below.
Next, under “Project” select “Emulate Project” to start the Emulator.
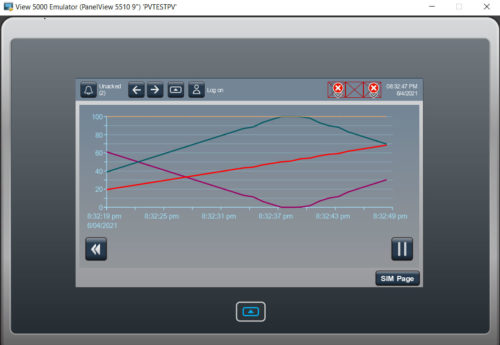
Here my emulator is running and I view my “TrendData” screen. When I am happy with all of my changes, then I can download to my Panelview 5510.
References
Conclusion
Building trends and traces in View Designer is about as simple to figure out as any other graphical addition, but putting forth the forethought and adding the needed trends to your project can make all the difference.
Testing with the emulator is a great feature because it allows you to see your changes at runtime without having to download to your Panelview hardware each time. My best to you in trending your valuable data.
Written by Brandon Cooper
Senior Controls Engineer and Freelance Writer
Have a question? Join our community of pros to take part in the discussion! You'll also find all of our automation courses at TheAutomationSchool.com.
Sponsor and Advertise: Get your product or service in front of our 75K followers while also supporting independent automation journalism by sponsoring or advertising with us! Learn more in our Media Guide here, or contact us using this form.
- Things I’ve Learned Travelling for Work (2) - July 17, 2025
- Things I’ve Learned Travelling for Work (1) - July 10, 2025
- Emulating an Allen-Bradley E3 or E3 Plus - June 30, 2025

Discover more from The Automation Blog
Subscribe to get the latest posts sent to your email.


